Products · Software
Logging, dashboard and AI training.
Both hub configurations run the same software. It records every stream on site and shows it on the operator dashboard. Models are trained on your data by our engineers and deployed to your edge device. Each block shows what is available, what is built to order and what is coming soon. Sensors and compute are described under Hubs & nodes.
Data logging
Available Versioned manifest · per-segment SHA-256 hashes · append-only journal · tiered retention · after a power loss the gap is logged, alerted and reported, and recording resumes by itself · exports: NWB, MKV/HEVC video, JSONL, CSV summaries
Built to order HDF5, Parquet, WAV with continuous audio, raw-signal CSV · Raspberry Pi 5 and laptop builds
Dashboard
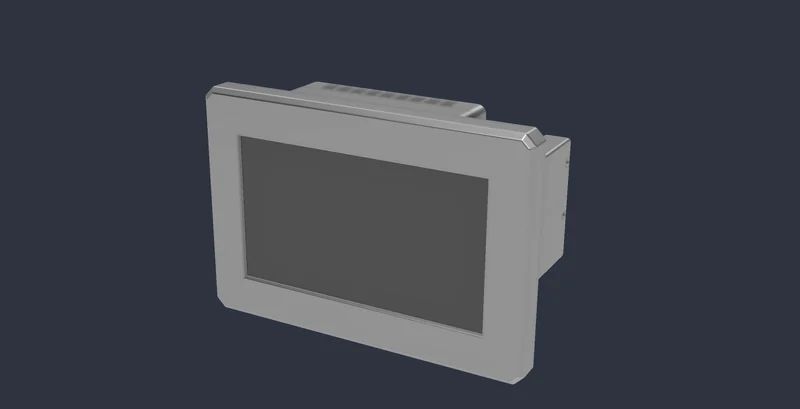
Available Operator dashboard on the hub over the local network: live status, sensors, previews, alerts, events, vibration view · kiosk screen at the machine
Built to order Grafana, OpenSearch and Kafka integration · mobile app · remote access with operator login
AI training & deployment
Available Custom models trained by our engineers on your data: feature extraction, anomaly detection, fault and multi-fault classification, severity grading; delivered as ONNX, with on-device inference first proven on our Vibration Node
Coming soon Self-service framework with labelling, training and deployment screens, for developers and for engineers who do not code · NPU inference
How we train and validate models
Start with the recordings you already have, for example WAV or CSV. We tell you what your data supports.
Send a data sampleNext step
Want a live demo?
We show logging and the dashboard with real recordings from our test rigs.