
Short answer
Acoustic monitoring of laser welding records the sound emitted by the keyhole and melt pool, either through the air with a microphone or through the part with an acoustic emission sensor. The signal carries information on keyhole stability, energy input, part-to-part gap and events such as pores or blowouts. Machine learning models trained on destructively verified welds can grade each weld inline from this signal.
Key takeaways
- The sound of a laser weld comes mainly from the oscillating keyhole and melt pool, and its spectrum changes when the process moves between conduction, stable keyhole and unstable keyhole modes.
- A 2025 study on aluminium busbar welds found sound power correlated with laser power at 0.95 at zero gap and negatively with the part-to-part gap (-0.797).
- Using X-ray radiography as ground truth, Shevchik et al. classified conduction, keyhole, blowout and pore events from acoustic emission and back-reflected light with confidence between 71 % and 99 %.
- Acoustic models are only as good as their labels and their validation: each joint type needs training data verified by cross-sections or mechanical tests, and validation across days and machines.
Acoustic monitoring of laser welding sounds almost too simple. Put a microphone near the weld, record, and listen for the bad ones. In practice the method works, but only if you understand where the sound comes from, which part of the spectrum carries the information, and how to turn a noisy signal into a quality grade you can defend.
I work on the data and model side of this at NeuroControls. This post summarises what the peer-reviewed research shows, what the signal does not tell you, and how we approach training and validation.
Where the sound of a laser weld comes from
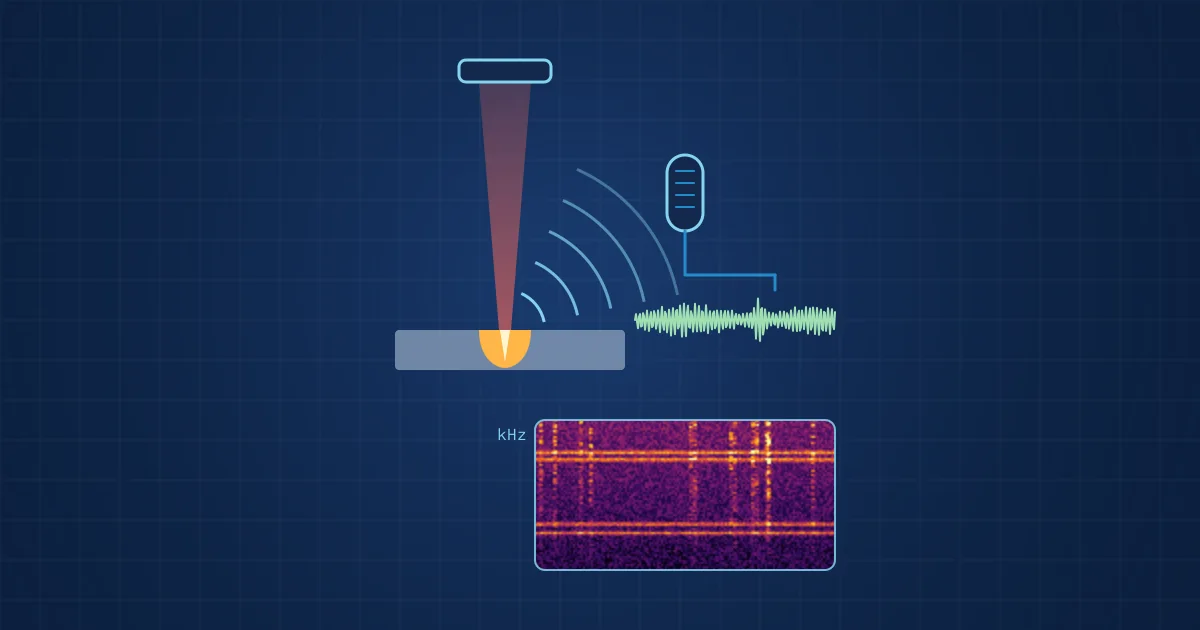
In deep penetration laser welding, the beam vaporises metal and opens a narrow cavity, the keyhole, surrounded by molten metal. The keyhole is not static. Vapour pressure, surface tension and melt flow make it oscillate, partially collapse and reopen. The melt pool and the escaping vapour plume move with it.
These pressure fluctuations radiate sound in two ways. Some of it travels through the air as airborne sound, from the audible range well into ultrasound. Some travels through the workpiece as structure-borne sound, usually called acoustic emission (AE) when measured at high frequencies with a contact sensor.
When the process changes regime, the sound changes. A stable keyhole produces a different spectrum from conduction welding, where the beam only melts the surface, and from an unstable keyhole that collapses and traps gas as pores.
Airborne sound and acoustic emission compared
The two sensing routes have different strengths. A review of acoustic methods in welding monitoring by Yusof, Ishak and Ghazali highlights the airborne method for its simple, non-contact and low-cost measurement system, and also notes a research gap: how the emitted sound changes with parameters, materials and surrounding noise is still not well documented.
| Aspect | Airborne microphone | Acoustic emission sensor |
|---|---|---|
| Coupling | Through air, no contact | Mounted on the part or fixture |
| Typical band | Audible to ultrasonic, depending on capsule | High frequencies, often well into the hundreds of kHz |
| Installation | Flexible, can sit beside the optics | Needs a stable contact path, hard on moving parts |
| Sensitivity to factory noise | Higher, needs filtering | Lower for airborne noise, but picks up fixture vibration |
| Sensitivity to transfer path | Distance and angle to weld | Clamping and part geometry |
Fraunhofer IDMT has worked on airborne-sound-based monitoring for MAG, laser, friction stir and stud welding. For MAG welding the institute reports detection of process irregularities with up to 95 % accuracy in feasibility tests, which shows that airborne sound carries usable information even in loud processes.
What the signal carries: evidence from the research
Energy input and gap
The most direct study for battery production I know of is by Basile et al. (2025), who welded 1 mm aluminium 1050 busbar-to-terminal joints with a remote laser and recorded airborne sound with a membrane-free optical microphone sampled at 2.5 MHz. Their main findings:
- sound power correlated with laser power with a coefficient of 0.95 at zero gap, and filtered sound power with a coefficient of 0.82 across all gaps
- sound power correlated negatively with part-to-part gap (-0.797)
- a spectral peak around 63 kHz was linked to stable keyhole formation
- two thresholds on filtered sound power separated lack of fusion, lack of connection and sound connections in their test set
They removed a band from 8 to 26 kHz with a band-stop filter before computing sound power, to suppress background noise. That detail matters: much of the useful information sat above the audible range.
The same paper summarises related work. Authier et al., combining OCT with a microphone, used a 40 to 90 kHz band for penetration depth. Omlor et al. found spatter-related features in the 10 to 800 kHz range in hairpin welding.
Keyhole events and pores
Shevchik et al. (2020), published in Scientific Reports, took a different route. They welded aluminium AA5005 with a pulsed fibre laser and recorded structure-borne acoustic emission at 10 MHz together with back-reflected laser light. As ground truth they used high-speed X-ray radiography at the ESRF synchrotron, which shows the keyhole and pores inside the metal.
From wavelet spectrograms of 2 ms signal windows, convolutional neural networks classified five categories: conduction welding, stable keyhole, unstable keyhole, blowout and pores. Classification results ranged from 71 % to 99 % across the categories, sensor combinations and network types they tested. Two observations from the paper are worth remembering. Surface-based monitoring can be unreliable because keyhole irregularities happen deep in the melt pool. And pores sometimes merged into a following keyhole and disappeared, which complicates labelling.
What the sound does not tell you
Acoustic monitoring has clear limits, and it is better to know them before a trial than after.
- Background noise. Fume extraction, cross-jets, robots and neighbouring stations all make sound. Basile et al. note that industrial noise and cross-jets remained untested in their set-up.
- Transfer path. Distance, angle and fixture design change the recorded spectrum. A model trained at one sensor position may not transfer to another.
- Indirectness. Sound is a consequence of the process, not a measurement of the joint. It correlates with penetration and gap; it does not measure them the way OCT measures depth.
- Joint-specific training. A model trained on aluminium busbars does not know what a good copper tab weld sounds like.
This is one reason to combine sound with other modalities, such as images of the seam and process light, as discussed in laser welding of battery cells: defects and inline inspection.
From signal to grade: how the models work
The modelling pipeline for acoustic weld inspection has four stages.
- Segmentation. Cut the recording into one segment per weld, using the laser trigger or the energy envelope.
- Features or representations. Either compute engineered features (band energies, spectral peaks, envelope statistics) or feed a time-frequency representation, such as a spectrogram or wavelet transform, to a neural network. I covered the trade-offs in feature engineering for industrial signals.
- Model. Start with anomaly detection trained on good welds, then add classification of known defect types once labelled examples exist, and finally severity grading.
- Validation. Hold out entire days, batches or machines, not random segments.
The validation step is where most acoustic projects go wrong. If all bad welds in the training set were made on the same afternoon, a model can learn the afternoon, for example a change in extraction noise, instead of the defect. The post on avoiding shortcut learning in industrial AI goes into this in detail, and how much training data acoustic inspection needs covers dataset size.
Labels must come from the joint itself: cross-sections, peel or shear tests, or X-ray. A label that says "parameter set B" is not a quality label.
A practical recipe for a first acoustic trial
- Choose one joint type and one station.
- Mount the microphone at a fixed, documented distance and angle, protected from spatter.
- Record at a sample rate that covers the ultrasonic range you expect to need; a study band up to around 100 kHz is a reasonable start for keyhole-related features.
- Produce deliberate variations: laser power steps, defined gaps, contaminated surfaces.
- Cross-section or mechanically test a representative subset of every variation.
- Record factory background noise separately, with the laser off.
- Train, then validate on welds recorded on a different day.
How NeuroControls approaches this
Our Acoustic Node uses a Microtech Gefell MK 301 E measurement capsule, with a capture band from 2 to 100 kHz; the band from 2 to 20 kHz is production-proven. It is available as a standalone logger and built to order as a hub node. The measurement chain was developed in our research projects, including e-LAS+, a project with Fraunhofer IDMT on ML-based multimodal inline inspection of laser weld seams in battery cell production, which ran from May 2023 to April 2026, according to the Fraunhofer IDMT project page. A summary of that work is in our post on e-LAS+ results.
Models for customers are trained by our engineers on the customer's own weld data, from anomaly detection through to severity grading. On-device inference as ONNX on the node CPU was first proven on our Vibration Node; NPU deployment is coming soon. How we structure that model ladder is explained on our models page. Applications in cell and module production are described on the battery production page.
Frequently asked questions
How does acoustic monitoring of laser welding work?
A microphone near the weld, or an acoustic emission sensor on the part, records the sound produced by the oscillating keyhole and melt pool. The signal is cut into one segment per weld and converted into features or spectrograms. A model trained on welds whose quality was verified destructively then grades each new weld as it is made.
What can the sound of a laser weld reveal?
Research shows that the acoustic signal correlates with laser power and energy input, drops as the part-to-part gap grows, and changes between conduction, stable keyhole and unstable keyhole regimes. With suitable ground truth, events such as blowouts and pores can be classified. The sound does not measure penetration depth directly the way optical coherence tomography does.
Is airborne sound or acoustic emission better for weld monitoring?
Airborne microphones need no contact, are flexible to install and cost less, but are more exposed to factory noise. Acoustic emission sensors pick up structure-borne sound at high frequencies and are less affected by airborne noise, but need a stable mechanical contact. The choice depends on the fixture, the noise environment and the defects that matter.
Which frequency range matters in acoustic laser weld monitoring?
Much of the useful information lies above the audible range. One 2025 study on aluminium busbar welds removed 8 to 26 kHz as background noise and linked a peak near 63 kHz to stable keyholes, while other work used 40 to 90 kHz for penetration depth. The relevant band should be confirmed for each joint type and set-up.
How much does factory noise affect acoustic weld inspection?
Background noise from extraction, cross-jets, robots and other stations can overlap with weld sound in frequency. Mitigations include fixed sensor positions, band filtering, recording background noise separately, and validating models on data from different days. Several published studies were performed in laboratory conditions, so industrial noise has to be tested on site.
Sources and further reading
- Basile et al. (2025): Monitoring part-to-part gap and laser power effects in remote laser welding of 1050 aluminum busbar-to-terminal connections via optical microphone sensing, Optics and Laser Technology 192
- Shevchik et al. (2020): Supervised deep learning for real-time quality monitoring of laser welding with X-ray radiographic guidance, Scientific Reports 10, 3389
- Yusof, Ishak, Ghazali (2021): Acoustic methods in real-time welding process monitoring, Journal of Mechanical Engineering and Sciences 15(4)
- Fraunhofer IDMT: Welding seam inspection by non-destructive testing
- Fraunhofer IDMT: e-LAS+ project page