Short answer
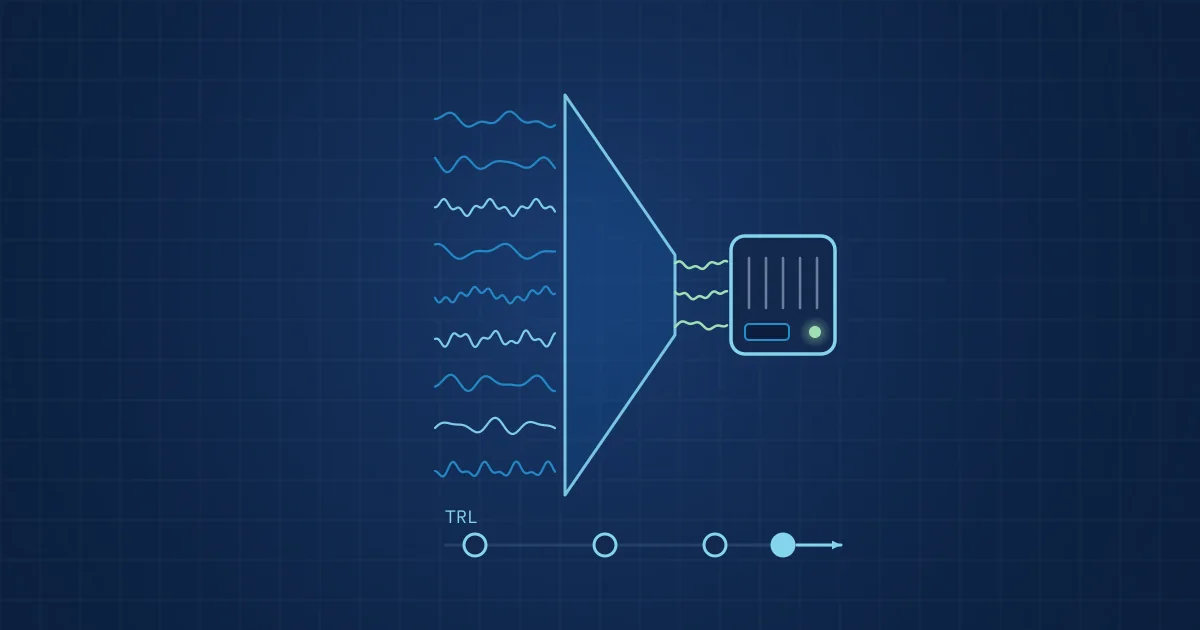
We develop custom sensing systems in stages. A feasibility study tests whether a physical signal carries the information at all. A research rig records many channels at high rates to find out which ones matter. A demonstrator proves the reduced set in a relevant environment. Only then is the system hardened into a product with self-monitoring sensors, reliable recording and models trained on real data.
Key takeaways
- The first question in any custom sensing project is physical, not algorithmic: does the signal carry the information you need, and at what rate and band.
- Research rigs deliberately over-measure, with more channels and higher rates than the final product, so the data can show which channels actually matter.
- The European technology readiness scale distinguishes validation in the lab (TRL 4), in a relevant environment (TRL 5) and demonstration in a relevant environment (TRL 6), which maps roughly onto the research rig (TRL 3 to 4) and the demonstrator (TRL 5 to 6) in the table below.
- Moving from demonstrator to product is mostly about robustness: sensor self-monitoring, recording that survives power loss, and models validated on data from more than one machine.
- Our Process Monitoring Kit is built on the measurement chain from the e-LAS+ and e-WAS projects, and our VCD4.3 freight-wagon sensor came out of the EdgeAI project.
Custom sensing systems rarely start as a product specification. They start as a question from a production or maintenance engineer: can we tell a good weld from a bad one while it is being made, or can we see a wheel flat without stopping the train? The path from that question to a system that runs unattended in a factory has distinct stages, and skipping one usually costs more time than it saves.
This article describes the stages we follow and illustrates each with a project we have worked on.
Stage 1: feasibility, or does the signal carry the information?
Every custom sensing project begins with a physical question. Before anyone talks about AI, we need to know whether a measurable quantity changes in a useful way when the thing we care about changes.
Our e-WAS project is a good example. In a 2021 feasibility study funded through ZIM, the German federal Central Innovation Programme for SMEs, which also funds feasibility checks ahead of R&D projects, we worked with VRI, LarsLabs and PORON on a sensor integrated into the weld head. We recorded the vibro-acoustic response at 64 kSPS. The result was clear: the damping after a successful weld was clearly measurable and scaled with weld current.
That is what a feasibility study should deliver: not a product, but evidence that the physics supports the idea, plus a first estimate of the band, sample rate and sensor position needed.
Stage 2: the research rig, measuring more than you need
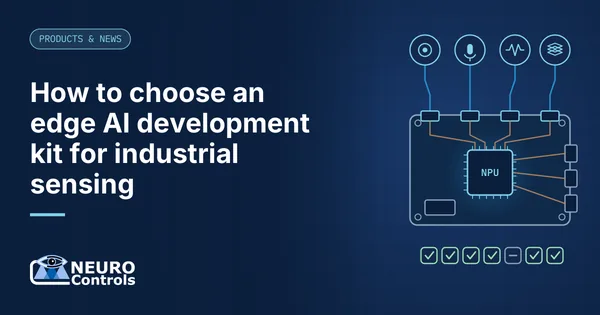
Once feasibility is shown, the next step is a research rig. Its job is to record as many plausibly relevant channels as possible, at higher rates and wider bands than any product would use, so that the data itself can decide what matters.
A good research rig:
- Combines several modalities, for example airborne sound, structure-borne vibration, cameras and thermal imaging.
- Samples well above the band you expect to need, because you do not yet know where the information is.
- Records raw data with time stamps, metadata and integrity checks in open formats.
- Covers good and bad cases, including deliberately provoked defects, under controlled conditions.
Our checklist for choosing sensors for a multimodal test rig describes the questions we ask at this stage.
In the e-LAS+ project, whose project period was May 2023 to April 2026 according to the Fraunhofer IDMT project page, we worked with Fraunhofer IDMT, SSI Software Service, SITEC and VRI on ML-based, multimodal inline inspection of laser weld seams in battery cell production. Fraunhofer IDMT focused on airborne sound analysis within the multimodal measurement method. The project's goals and organisation are summarised in our article on e-LAS+.
Stage 3: the demonstrator, proving it outside the lab
A rig in a lab is not a factory. A demonstrator runs the reduced set of channels in a relevant environment: real machine, real noise, real operators, real variation between parts and batches.
The European Commission's technology readiness level definitions, used across Horizon 2020, give a useful vocabulary here: TRL 4 is technology validated in the lab, TRL 5 technology validated in a relevant environment and TRL 6 technology demonstrated in a relevant environment. TRL 7 is a system prototype demonstrated in an operational environment.
According to the Fraunhofer IDMT project page, all e-LAS+ results were to be demonstrated in a pilot plant. In the EdgeAI project, a KDT JU research and innovation action coordinated by SINTEF that ran from December 2022 to June 2026, we led the demonstrator VCD4.3: an energy-autonomous freight-wagon sensor that is powered by the vibration it monitors, is read out over passive RFID and grades wheel flats and bearing faults on board. Its story is told in our article inside VCD4.3.
| Stage | Main question | Typical output | TRL range (indicative) |
|---|---|---|---|
| Feasibility | Does the signal carry the information? | Measurements, band and rate estimate | 2 to 3 |
| Research rig | Which channels and features matter? | Labelled multimodal dataset, first models | 3 to 4 |
| Demonstrator | Does it work in a relevant environment? | Reduced system on a real or pilot machine | 5 to 6 |
| Product | Does it work unattended, for years? | Hardened hardware, validated models, documentation | 7 and above |
Stage 4: reducing to what matters
The research rig almost always measures more than the product needs. The reduction step uses the recorded data to answer: which modalities, bands and positions carry the decision? Which can be dropped without losing performance? Which are needed only as plausibility checks?
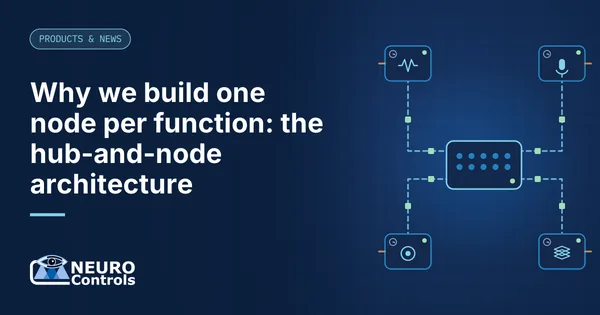
This is where our one-node-per-function architecture pays off. Because each function is a separate node, a system can be configured with exactly the channels the data justifies, without redesigning the rest.
Stage 5: hardening into a product
The difference between a working demonstrator and a product is mostly invisible in a demo. It is everything that happens when nobody is watching.
- Self-monitoring sensors. Each sensor reports its signal health and dropouts with the data, so a channel that goes silent is flagged.
- Recording that survives reality. Versioned manifests, per-segment SHA-256 hashes and an append-only journal; after a power loss, the gap is logged, alerted and reported and recording resumes by itself.
- Honest time stamps. Every stream is time-stamped on the hub, and each node's clock offset is measured continuously and written into every record, with its uncertainty.
- Models validated beyond one machine. Custom models are trained by our engineers on customer data and validated on data held back from training, ideally from other machines, batches or time periods, before they are deployed.
- Operator view. A dashboard on the hub shows live status, previews, alerts, events and a vibration view over the local network.
Our Process Monitoring Kit follows this path: it is built on the measurement chain from e-LAS+ and e-WAS, combines the hub with acoustic and vision nodes, optionally vibration, and is built to order.
What we are developing now
The same path continues. In DIGIBATT360, which according to the Fraunhofer IIS project page runs from February 2026 to January 2029 with funding from the German Federal Ministry of Research, Technology and Space, and which was publicly launched in July 2026 under VARTA Storage's coordination with Fraunhofer IIS, Circulor and VRI, the consortium is building an EU-compliant digital battery passport on a decentralised data space. Our public role is cognitive sensing and returned-goods analysis. Within it we are developing an inline edge node designed to grade every weld of a battery module, and the verdict is designed to go into the module's battery passport. More on the project is in our article on DIGIBATT360.
How we start custom sensing systems projects
If you have a measurement question that no standard product answers, the starting point is a conversation about the physics: what changes, where, how fast and how you would know if you were right. From there we can propose a feasibility step, a rig or, if the question is already well understood, a configuration from our existing nodes.
It helps to bring a few things to the first conversation:
- The decision you want to make, for example scrap or keep a part, schedule a bearing change or stop a line, and how quickly it has to be made.
- What you already know: failure history, quality data, end-of-line test results, previous measurement attempts and why they did or did not work.
- Access constraints: where sensors can and cannot be mounted, cycle times, temperatures, coolant, cleaning and safety rules.
- Examples of good and bad, or a realistic way of producing them, because every later stage depends on recordings of both.
- Where results must go: an operator screen, a quality record, a maintenance system or a product passport.
With these on the table, it is usually possible to say within one or two meetings which stage the project starts at and what the first deliverable should be.
Our custom systems page explains how such projects are set up, and our research projects overview lists the funded work behind our products.
Frequently asked questions
How long does it take to develop a custom sensing system?
It depends on how much is already known. If the physics is understood and existing nodes cover the required channels, a configured system can be specified quickly. If feasibility is open, a short feasibility study comes first, followed by a research rig and a demonstrator. Each stage has a clear question, so the project can stop early if the signal does not carry the information.
What is a technology readiness level?
Technology readiness levels describe how mature a technology is, from TRL 1, basic principles observed, to TRL 9, actual system proven in an operational environment. In the European Commission's Horizon 2020 definitions, TRL 4 means validated in the lab, TRL 5 validated in a relevant environment, TRL 6 demonstrated in a relevant environment and TRL 7 a system prototype demonstrated in an operational environment.
Why does a research rig measure more channels than the final product?
At the start, nobody knows exactly which modality, band or sensor position carries the information. A research rig records more channels at higher rates so the data can answer that question. The product then uses only the channels that proved useful, which reduces cost, installation effort and data volume without guessing in advance.
What makes a sensing demonstrator ready to become a product?
A demonstrator shows that the method works in a relevant environment. A product must work unattended for years. That requires sensors that report their own health, recording that survives power loss and logs gaps, honest time stamps with known uncertainty, models validated across machines or batches, and an operator view that maintenance staff actually use.
Which of your products came out of research projects?
Our Process Monitoring Kit is built on the measurement chain developed in the e-LAS+ and e-WAS projects on weld monitoring. The VCD4.3 energy-autonomous freight-wagon sensor was the demonstrator we led in the EU EdgeAI project. In DIGIBATT360, where our role is cognitive sensing and returned-goods analysis, we are developing an inline edge node designed to grade every weld of a battery module; the verdict is designed to go into the module's battery passport.
Sources and further reading
- ZIM Central Innovation Programme for SMEs (English overview)
- Fraunhofer IDMT: e-LAS+ multimodal quality assurance for production of electricity storage
- CORDIS: EdgeAI, Edge AI Technologies for Optimised Performance Embedded Processing
- European Commission: Technology readiness levels, Horizon 2020 General Annex G
- Solarserver: Digitaler Batteriepass, VARTA Storage startet Projekt DIGIBATT360 (9 July 2026)
- Fraunhofer IIS (Supply Chain Services): DIGIBATT360, Digital Circular Economy for Batteries